
logler is a Rust-powered log investigation engine. It parses log files into an in-memory index, then exposes search, hierarchy building, thread tracking, error flow analysis, and cross-service timeline reconstruction through a Python API and a 25-command JSON CLI built for LLM agents. The question: how fast is it, and where does the memory go?
Three rounds of benchmarking answered both; two measurement bugs nearly undermined the answers.
Methodology
All measurements use deterministic synthetic data (LogGenerator(seed=42)), time.perf_counter() for timing, and a confidence classification that requires zero overlap in timing distributions to earn “definitive.” Same machine, same Python 3.12.11, same Rust backend across all three rounds. 8-core Linux x86_64.
19 scenarios across 7 suites: search, hierarchy, correlation, output, sampling, memory, and database source. Each scenario runs warmup iterations (discarded), then 5 measured iterations. Statistics reported: min, median, p95, p99, stddev, coefficient of variation.
The full benchmark suite is reproducible from source; uv run python -m benchmarks run --scale small runs all 19 scenarios. Every chart in this post was generated from the same JSON the suite produces.
Round 1: The Baseline
The first run measured 14 scenarios across 5 suites. Some numbers were fine; some were not.
| Operation | Time | Scale |
|---|---|---|
| Hierarchy building | 85.9s | 50K entries |
| Smart sampling (diverse) | 9.2s | 50K |
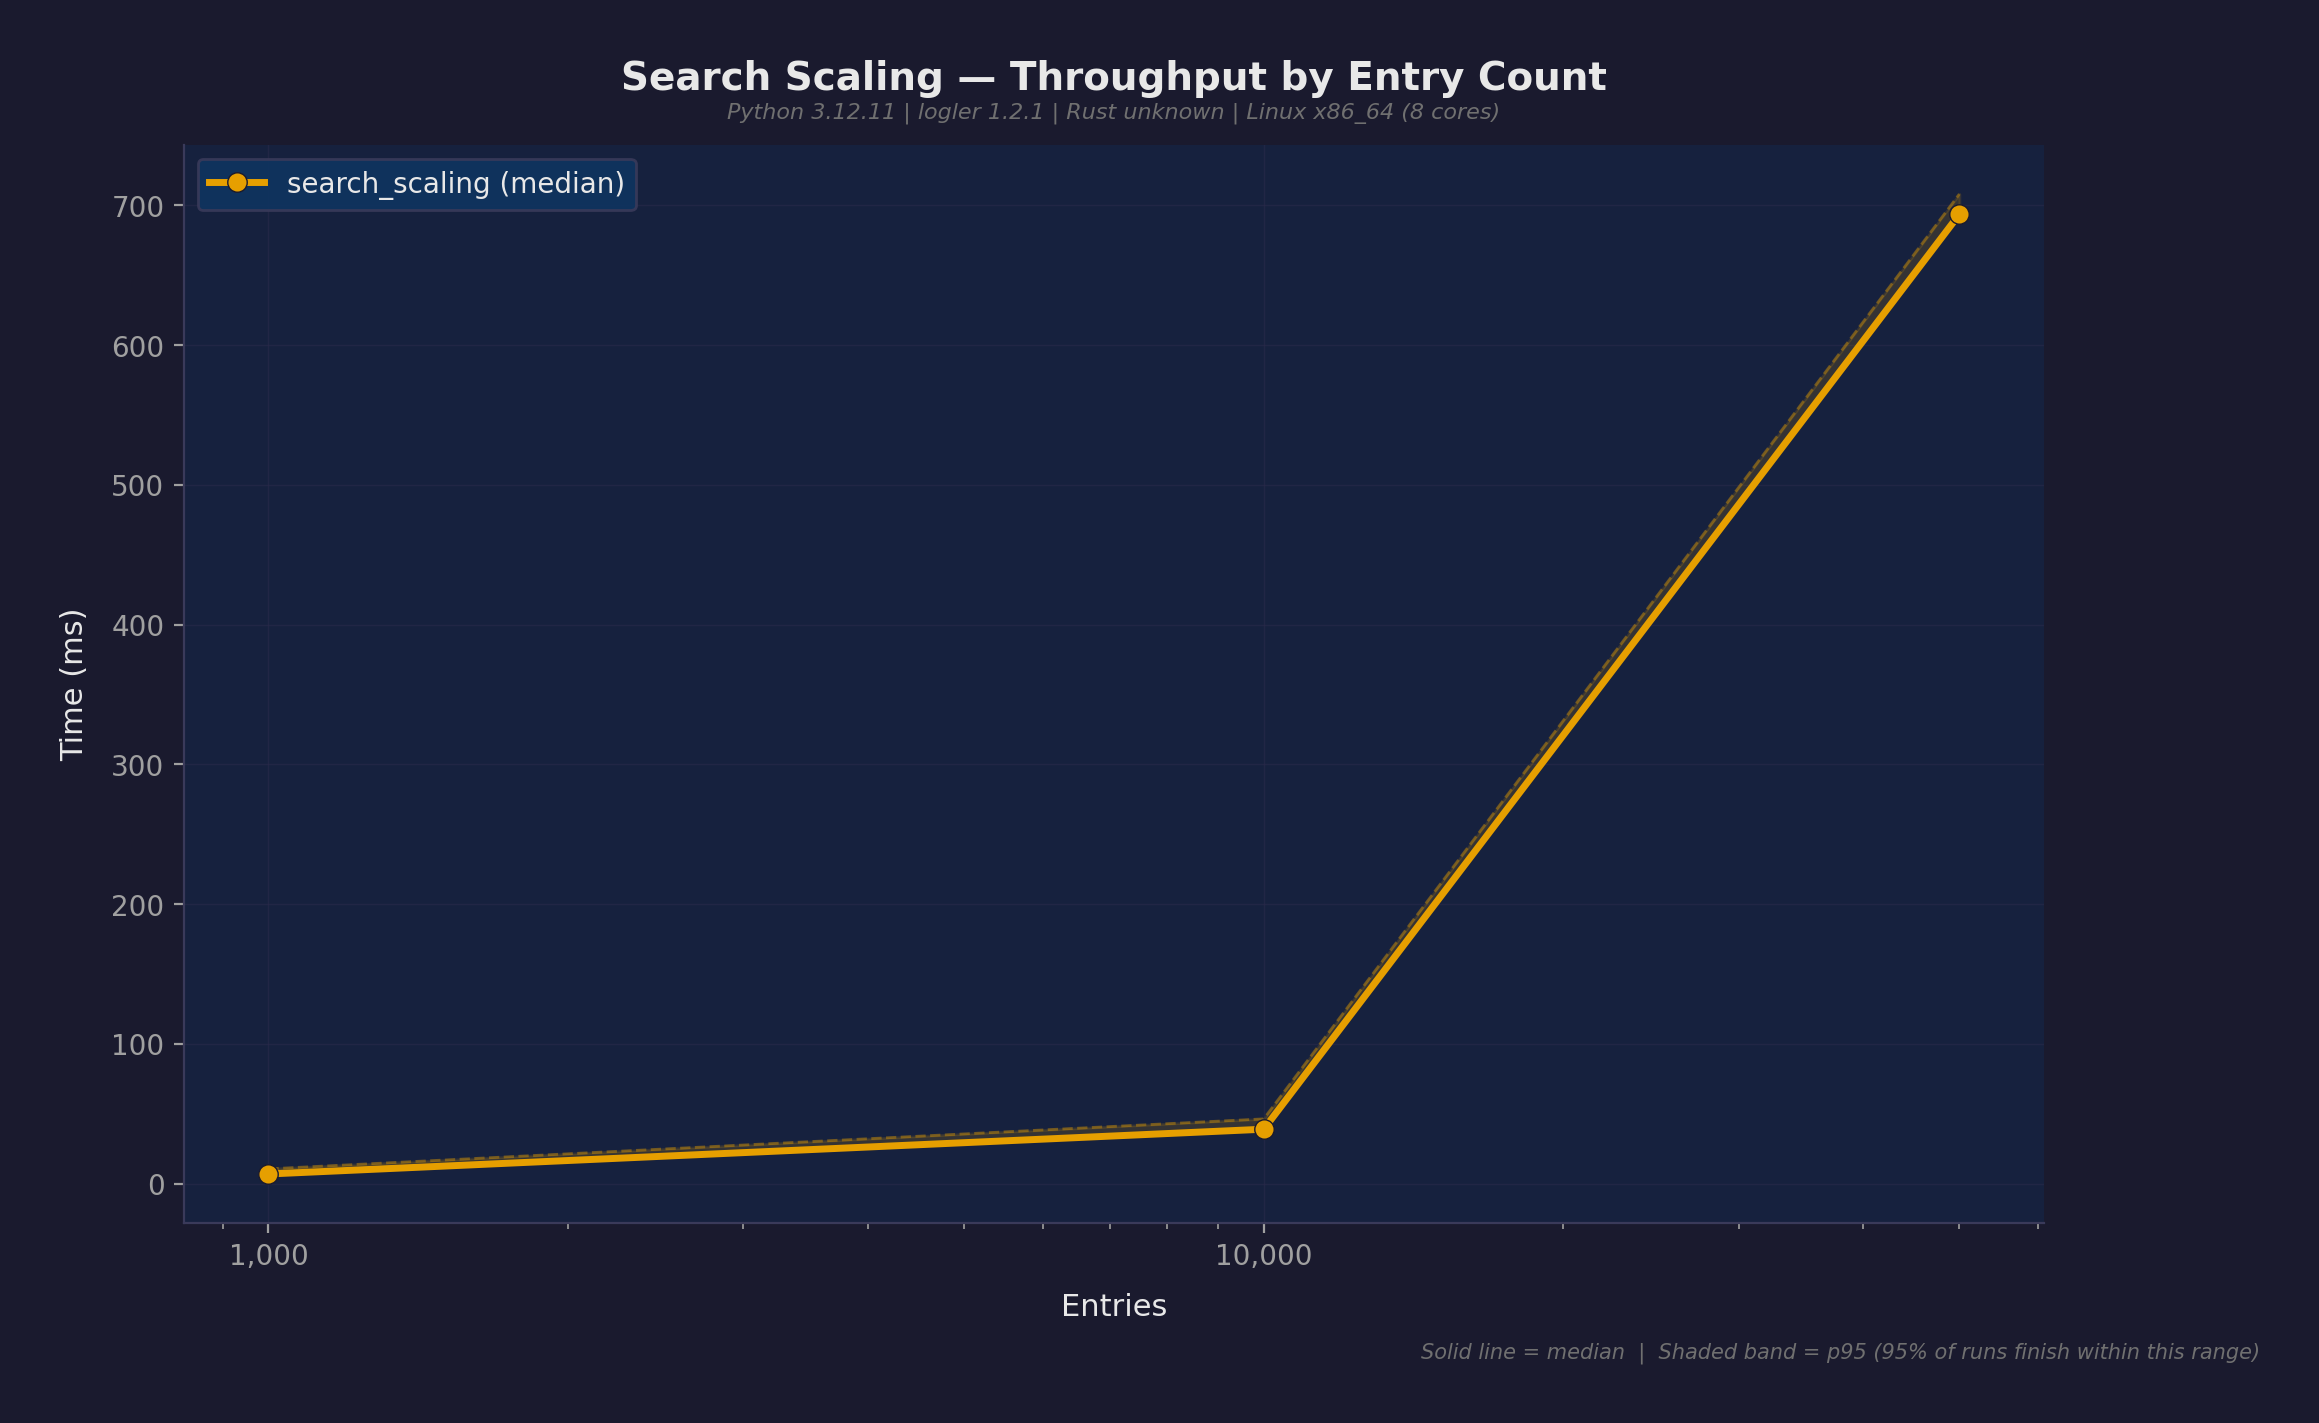
| Search (level filter) | 693.7ms | 50K |
| Follow thread | 2.60ms | 1K |
| Cross-service timeline | 13.1ms | 5 services |
| Error flow analysis | 0.15ms | small |
Hierarchy building at 86 seconds was the obvious problem. The algorithm — infer_children_from_naming() in the Rust core — scanned all thread and span IDs for each parent node to find children by naming patterns (e.g., worker-1 → worker-1.task-a). That’s O(parents × unique_IDs); at 50K entries with realistic ID cardinality, it’s quadratic.
Smart sampling was the second problem: smart_sample() fetched every entry (search(limit=None)), deserialized all 50K into Python dicts, then sampled 50. It threw away 49,950 of them.
Round 2: Three Fixes
Three targeted optimizations, each independently testable and revertable.
Fix 1: BTreeSet prefix index (Rust)
infer_children_from_naming() scanned all IDs for each parent. Replaced with a BTreeSet<String> populated during add_entry(), using range() for O(log n + k) prefix lookups where k is the number of actual matches.
Hierarchy building at 50K went from 85.9s to 349ms. 246x speedup, definitive confidence — v2’s worst case (360ms) was faster than v1’s best case (85.7s). Zero overlap in timing distributions.
Fix 2: Cached investigator (Python)
Five functions — follow_thread, find_patterns, get_metadata, follow_thread_hierarchy, detect_correlation_chains — were creating a new Rust Investigator and re-parsing all files on every call. get_cached_investigator() now returns a pre-parsed instance keyed on sorted file paths and mtimes.
This also uncovered a latent crash: detect_correlation_chains() called logler_rs.search() with 10 arguments when the standalone function only accepts 3. It would have failed at runtime if anyone had actually called it.
Fix 3: Capped smart_sample (Python)
Fetch at most sample_size × 10 entries (minimum 500) instead of everything. Read total_matches from the Rust search result — it returns the pre-truncation count even with a limit, so one search gives both the sample pool and the exact population size. No separate count query needed.
Round 2 Results
43 measurements total; 31 improved, 4 regressions.
| Operation | v1 | v2 | Speedup | Confidence |
|---|---|---|---|---|
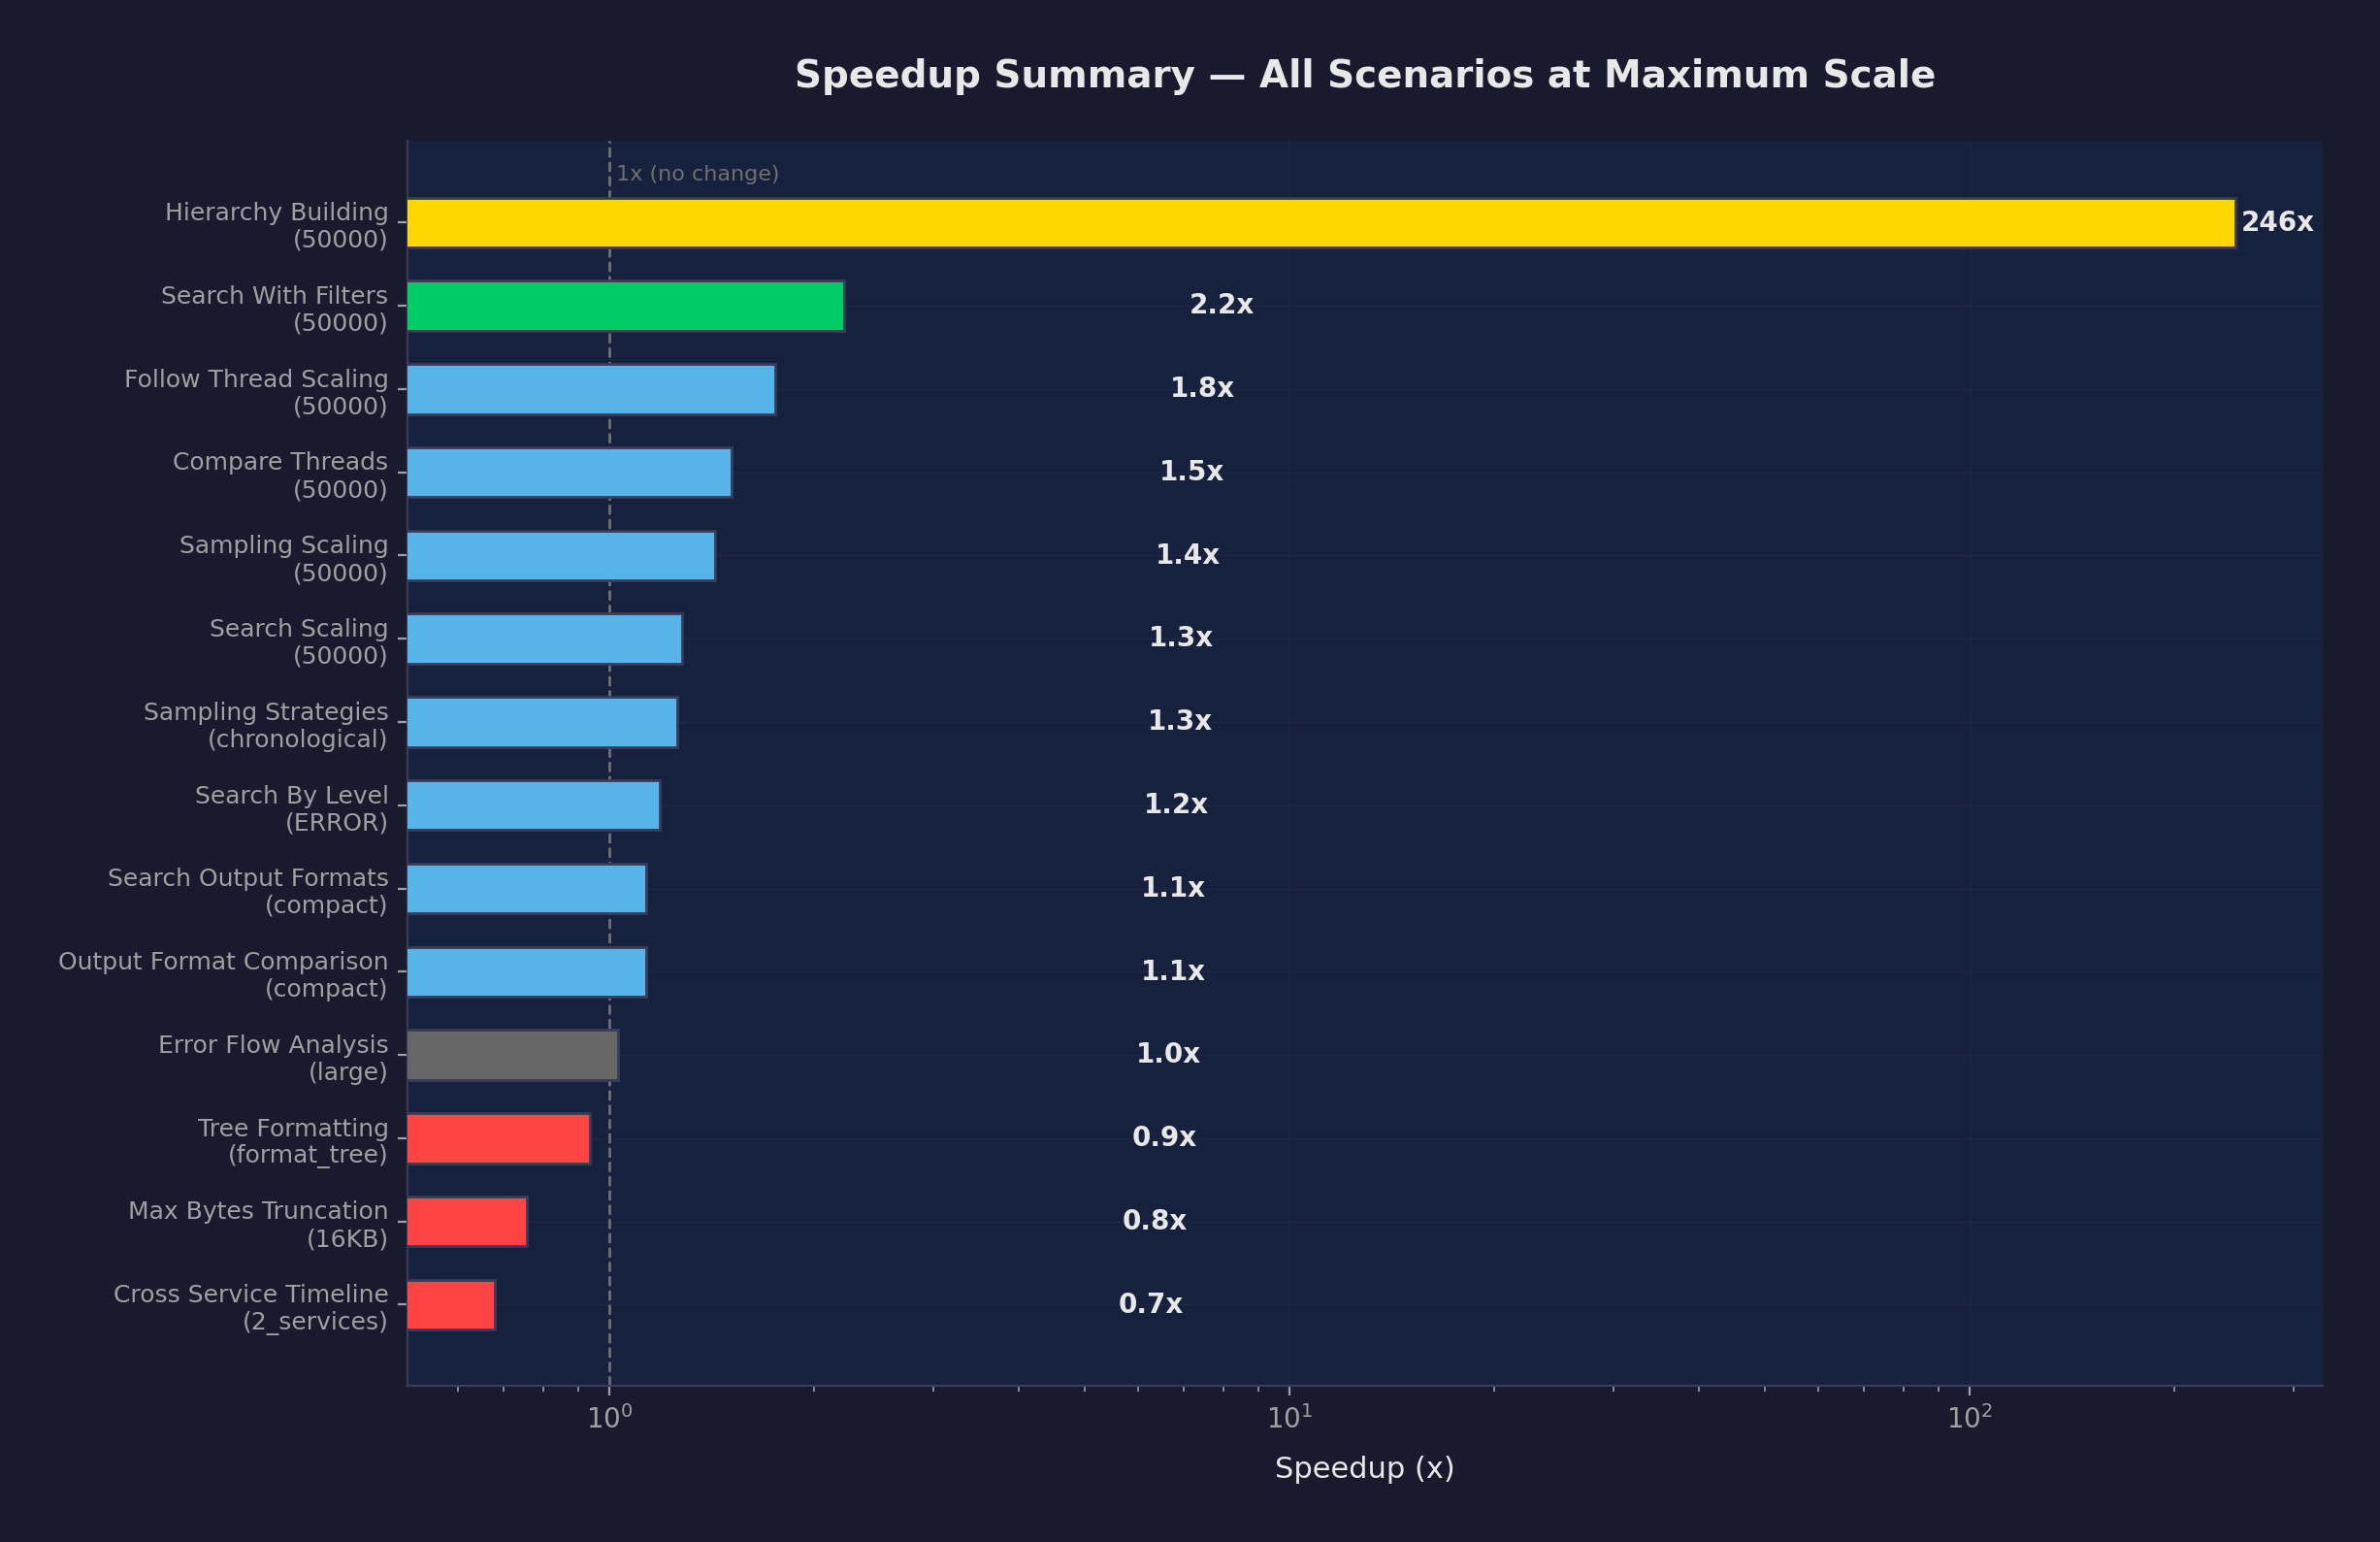
| Hierarchy building (50K) | 85.9s | 349ms | 246x | definitive |
| Hierarchy building (10K) | 3.01s | 66.9ms | 45x | definitive |
| Follow thread (1K) | 2.60ms | 0.38ms | 6.8x | definitive |
| Search with filters (10K) | 25.4ms | 4.50ms | 5.6x | definitive |
| Smart sampling (10K) | 778ms | 196ms | 4.0x | definitive |
| Compare threads (1K) | 6.19ms | 1.58ms | 3.9x | definitive |
The 4 regressions: max_bytes_truncation (1.13–1.32x slower) and cross_service_timeline at 2 services (1.47x slower). Both are explained by the cached investigator’s startup cost; for operations that were already sub-10ms, the cache lookup adds measurable overhead relative to the operation itself.
Round 3: Memory
Round 2 made logler fast. Round 3 asked: does it fit in memory?
logler’s PyInvestigator holds all parsed entries in an in-memory Rust index. At 600K+ entries, load_files() alone uses ~800 MB. Three Python code paths amplified this baseline by accumulating additional data structures on top of the already-large index.
Fix 4: Two-phase search (Rust)
search() materialized every match into a full Python dict. A broad query (level=INFO, ~60% of corpus) at 100K entries would create 60K dicts on top of the index.
Phase 1 now filters and scores using lightweight MatchCandidate structs (~40 bytes each). Phase 2 materializes only the final N results (default limit=100). Search working set dropped from O(matches) to O(limit).
Fix 5: Streaming db_to_jsonl (Python)
db_to_jsonl collected all tables’ entries into a single list, sorted cross-table, then wrote to JSONL. Replaced with per-table streaming; no cross-table sort needed.
Fix 6: Generator-based table reading (Python)
_read_sqler_table used fetchmany(1000) for batched reading but accumulated all converted entries into a list before returning. The streaming was a lie — 100K rows meant 100K dicts in memory before a single byte hit disk. Converted to a generator with yield; peak memory is now proportional to one batch (~1,000 entries), not the full table.
Memory Results
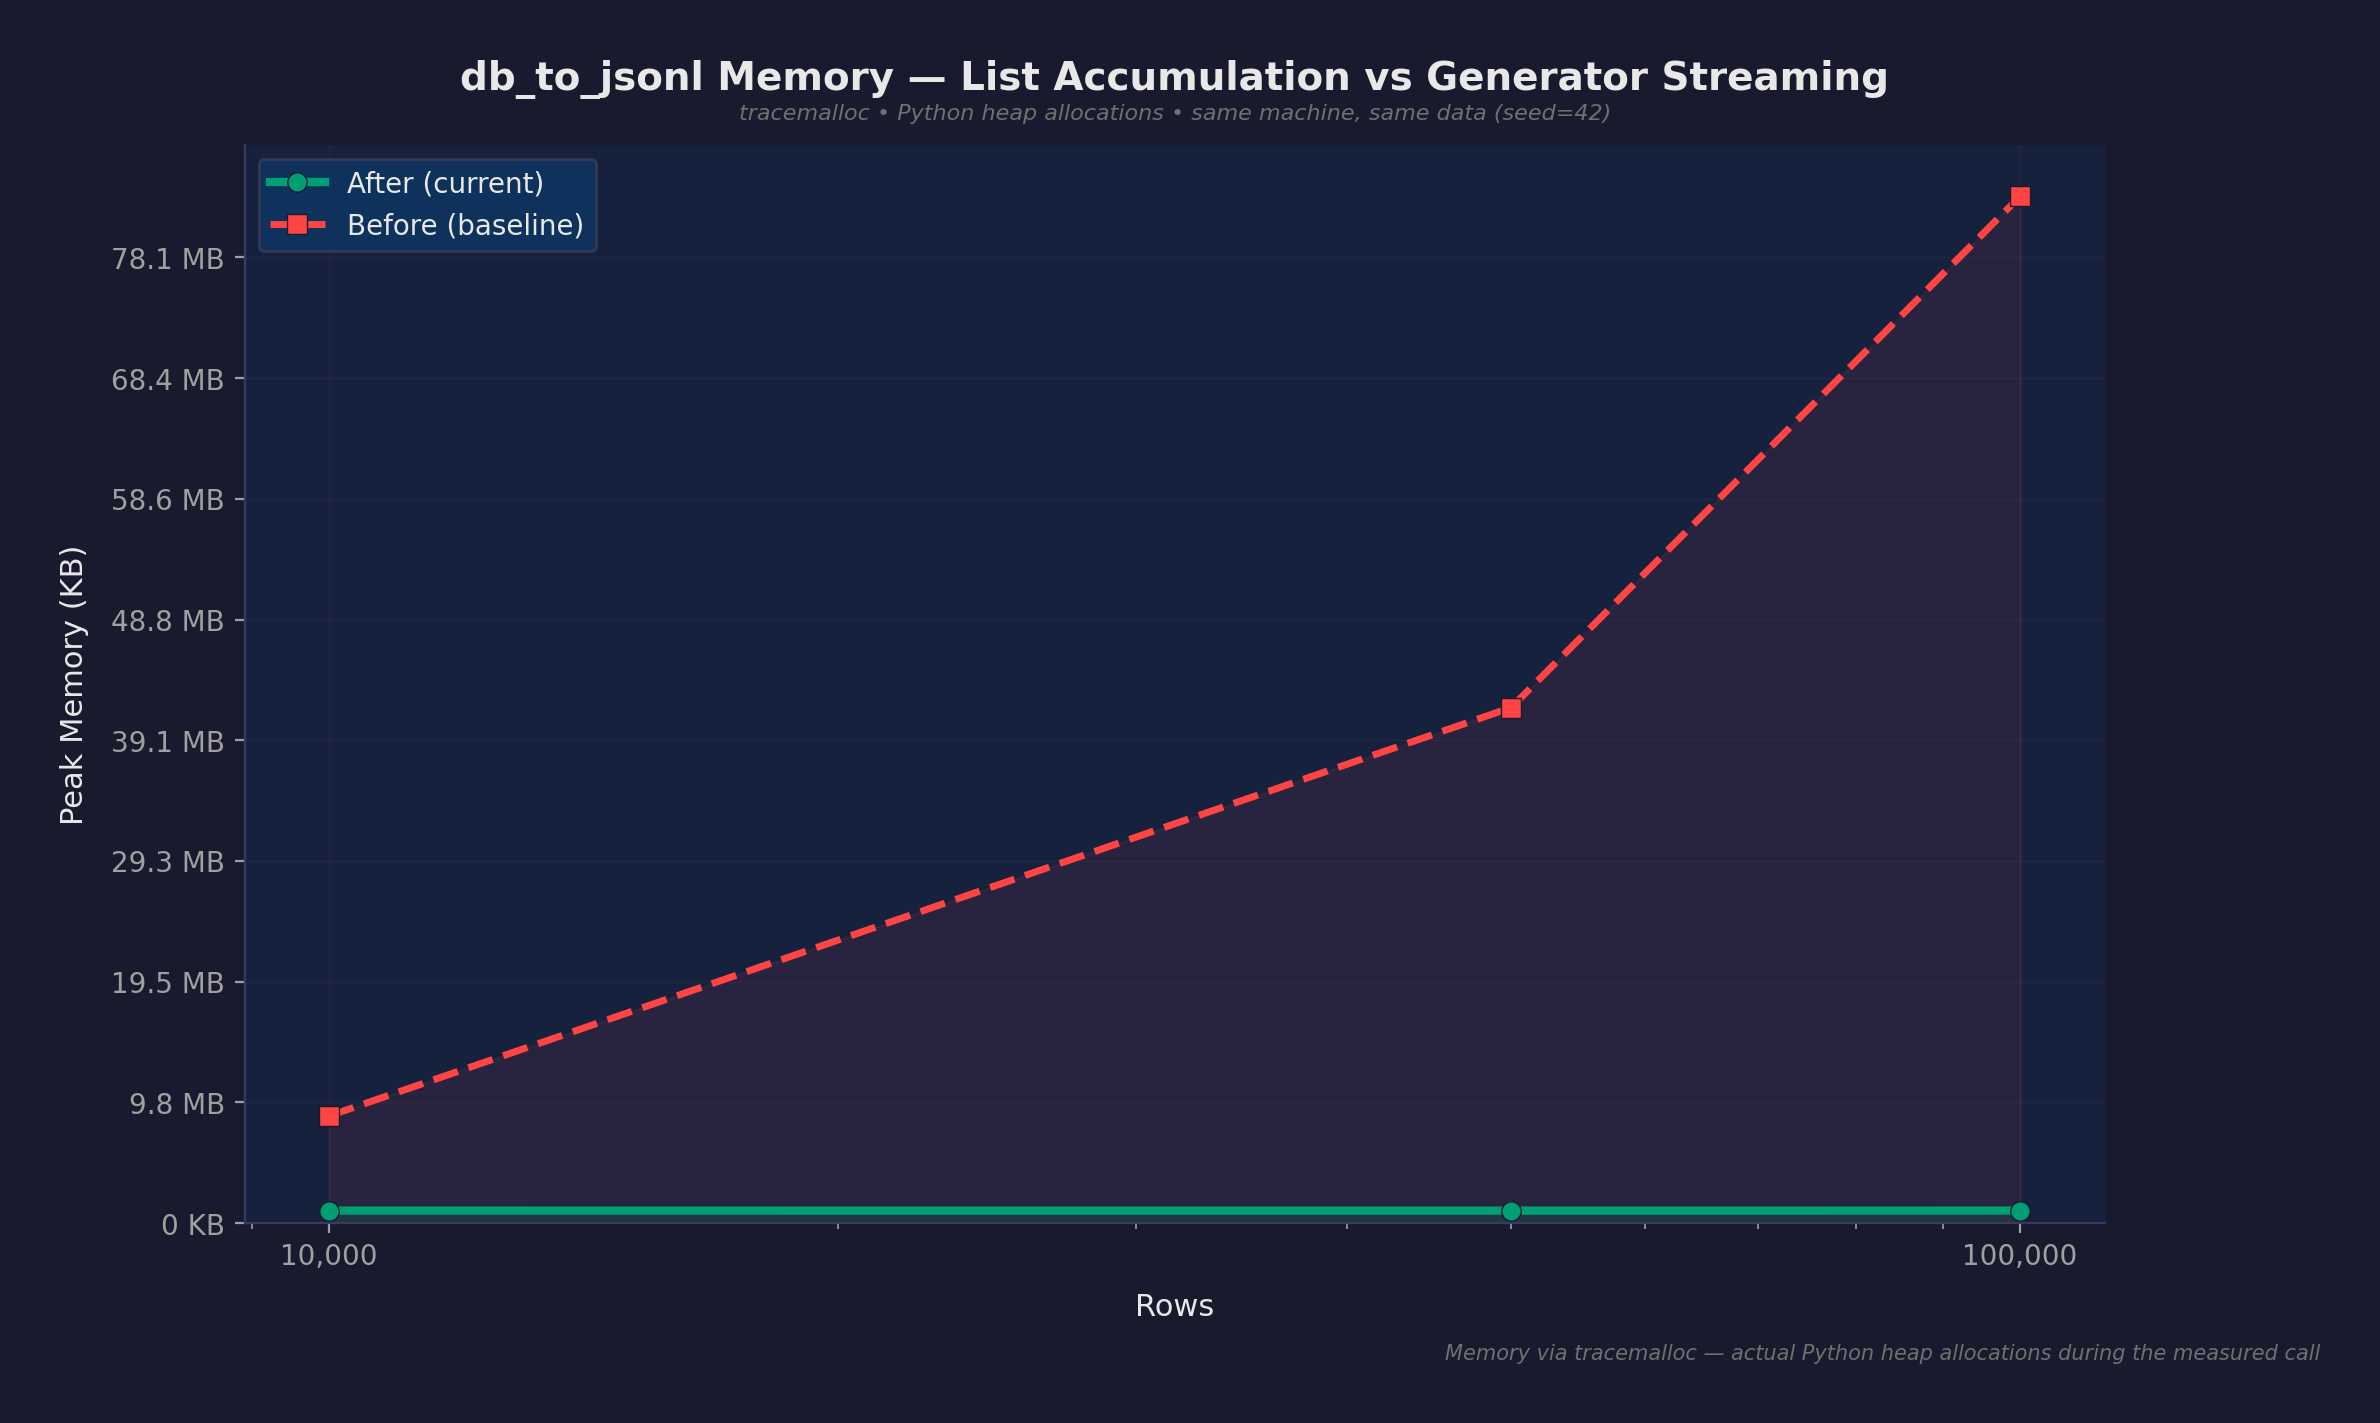
Measured with tracemalloc (Python heap allocations during the measured call):
| Scenario | Before | After | Reduction |
|---|---|---|---|
| db_to_jsonl (10K rows) | 8.7 MB | 1.0 MB | 8.6x |
| db_to_jsonl (50K rows) | 41.7 MB | 1.0 MB | 41.6x |
| db_to_jsonl (100K rows) | 83.1 MB | 1.0 MB | 82.6x |
Before: scales linearly at ~850 bytes/row. After: flat at ~1 MB regardless of table size.
Search Python heap allocation also stayed flat:
| Scale | Peak Allocation |
|---|---|
| 10K entries | 1.6 MB |
| 50K entries | 1.6 MB |
| 100K entries | 1.6 MB |
Round 3 Speed Improvements
The memory fixes also produced speed gains. v3 comparison against the v2 baseline:
| Operation | v2 | v3 | Speedup | Confidence |
|---|---|---|---|---|
| Search by level INFO (50K) | 3.77s | 31.2ms | 121x | definitive |
| Sampling diverse (50K) | 8.50s | 142.8ms | 60x | definitive |
| Sampling chronological (50K) | 7.24s | 151.1ms | 48x | definitive |
| Search scaling (50K) | 543ms | 26.9ms | 20x | definitive |
The 121x on search-by-level is from the two-phase search; the old code materialized every match, and INFO is ~60% of entries. With two-phase, only the final page of results crosses the FFI boundary.
Two Measurement Bugs
Bug 1: ru_maxrss reports nothing
Our first attempt at proving the memory fixes used resource.getrusage(RUSAGE_SELF).ru_maxrss — the peak RSS for the entire process lifetime. Once pytest imports set the high-water mark (~1 GB), subsequent operations that stayed below it reported 0 KB “allocated.”
The numbers said: “db_to_jsonl at 100K rows allocates 0 KB.” That’s not a measurement; that’s a ceiling nobody hit. We almost shipped it as proof that streaming worked.
Switched to tracemalloc, Python’s built-in heap allocation tracker. It measures actual allocations during the measured call, not process-level high-water marks.
Bug 2: tracemalloc can’t see Rust
Caught the first bug. Switched to tracemalloc. Then asked: will this survive scrutiny?
Ran both measurements side by side on a 100K-entry search:
tracemalloc (Python heap):   16.3 MB peak
VmRSS (whole process):      +218 MB delta
tracemalloc said 16 MB. The process actually grew 218 MB. The difference is Rust memory — PyInvestigator parses the entire file into an in-memory index, and tracemalloc is completely blind to allocations on the other side of the FFI boundary.
The “search stays flat at 1.6 MB” claim was technically accurate for the Python wrapper. But the actual operation loaded 100K entries into a Rust index that consumed 218 MB. It’s like measuring how much fuel the dashboard uses and claiming the car is fuel-efficient.
The fix: measure both
Report tracemalloc (Python heap) and VmRSS (total process memory) side by side. Be explicit about what each tool can and cannot see.
| Claim | Honest? | Why |
|---|---|---|
| db_to_jsonl: 83 MB → 1 MB | Yes | Pure Python pipeline; tracemalloc sees everything |
| Search Python heap flat at 1.6 MB | Yes, with caveat | Rust index is 218 MB, invisible to tracemalloc |
| Overall system memory bounded | No | Rust index scales at ~1.9 KB/entry; 600K entries ≈ 1.1 GB |
The Remaining Bottleneck
The Rust in-memory index is the known remaining cost. At 100K entries the index consumes ~192 MB (~1.9 KB per entry). The Python-side optimizations are done — streaming works, search working set is bounded, two-phase materialization keeps the FFI cost proportional to result count, not corpus size.
Three approaches to reduce the index cost, in order of increasing ambition:
- Lazy file-offset indexing — first pass records byte offsets and minimal metadata; full entries are parsed on demand during result rendering.
- Memory-mapped backing — replace the in-memory
Vec<Entry>with an mmap’d file; the OS pages entries in and out as needed. - Subprocess isolation — spawn the measured operation in a subprocess for per-operation VmRSS without interference from prior measurements.
These are deferred, not hidden. The index cost is documented, the per-entry overhead is measured, and the fix requires a Rust refactor of PyInvestigator.
Final Numbers
The cumulative effect of all six fixes, v1 baseline to v3 current:
| Operation | v1 (baseline) | v3 (current) | Total speedup |
|---|---|---|---|
| Hierarchy building (50K) | 85.9s | 332ms | 259x |
| Search by level INFO (50K) | 3.71s | 31.2ms | 119x |
| Sampling diverse (50K) | 9.21s | 143ms | 64x |
| Sampling chronological (50K) | 9.13s | 151ms | 60x |
| Sampling errors_focused (50K) | 9.20s | 273ms | 34x |
| Search scaling (50K) | 693.7ms | 26.9ms | 26x |
| Search with filters (50K) | 172.8ms | 16.5ms | 10.5x |
| Compare threads (1K) | 6.19ms | 0.82ms | 7.5x |
| Follow thread (1K) | 2.60ms | 0.37ms | 7.0x |
| db_to_jsonl memory (100K) | 83.1 MB | 1.0 MB | 83x reduction |
Every speedup above 2x has definitive confidence — zero overlap in timing distributions between v1 and v3.
Known Caveats
- Single machine. All measurements on one 8-core Linux x86_64 box. No cross-platform numbers.
- Synthetic data.
LogGenerator(seed=42)produces realistic but artificial logs; real-world distribution may differ. - No I/O measurement. Benchmark timing starts after files are written to disk. File parsing is included; disk read latency is not.
- Rust index cost not included in speedup claims. The index is built once per file set and cached; benchmarks measure operations against a warm index.
- max_bytes_truncation regressed. 1.07–1.28x slower in v3. The cache lookup overhead is proportionally significant for operations that were already sub-second.
- Memory numbers are Python-side only unless explicitly labeled as VmRSS. The Rust index adds ~1.9 KB/entry on top.
Benchmark source: github.com/gabu-quest/logler/tree/main/benchmarks. Full reports: v1 baseline, v2 comparison, v3 report.