
The initial benchmarks told us exactly where logler was slow. Hierarchy building took 86 seconds at 50K entries. Smart sampling took 9 seconds. Five of eight core functions were re-parsing files on every call.
Three changes fixed it. Each one independently testable and revertable. Here’s what we found, what we changed, and what the numbers say.
The Bottlenecks
The v1 benchmark suite (14 scenarios, 43 measurements) exposed three categories of waste:
| Problem | Symptom | Root Cause |
|---|---|---|
| Hierarchy building | 86s at 50K entries | O(n^2) scan in naming inference |
| Smart sampling | 9s at 50K entries | Deserializing 50K entries to sample 50 |
| Repeated parsing | 260ms per follow_thread() call | Each function creates a new Rust investigator |
Change 1: Cached Investigator for All Functions
Problem: Five of eight core functions called standalone Rust functions that create a new Investigator instance — re-parsing all files every time. Only search(), extract_ids(), and get_context() used the cached path.
| Function | Before | After |
|---|---|---|
search() | cached | no change |
extract_ids() | cached | no change |
get_context() | cached | no change |
follow_thread() | re-parse every call | cached |
find_patterns() | re-parse every call | cached |
get_metadata() | re-parse every call | cached |
follow_thread_hierarchy() | re-parse every call | cached |
detect_correlation_chains() | broken (wrong arg count) | fixed + cached |
The cache is an LRU keyed on (sorted_file_paths, file_mtimes). Same files, same modification times → same investigator. Files change → new investigator.
The fix for detect_correlation_chains() deserves mention: it was calling logler_rs.search() with 10 arguments, but the standalone function only accepts 3. It would crash at runtime if ever called. Wiring it through the proper search() function fixed both the bug and the performance.
Impact: follow_thread() at 1K entries dropped from 2.6ms to 0.38ms (6.8x faster). At 50K entries, from 259ms to 148ms (1.75x faster).
Change 2: BTreeSet Prefix Index for Hierarchy
Problem: infer_children_from_naming() in the Rust hierarchy builder scanned ALL thread and span IDs for each parent node to find children by naming patterns. For every parent like worker-1, it checked every ID to see if it started with worker-1., worker-1:, or worker-1-. With P parents and N unique IDs, that’s O(P x N) — effectively O(n^2).
At 50K entries with thousands of unique IDs, this took 86 seconds.
Fix: Build a BTreeSet<String> of all IDs during add_entry(). Use range() for O(log n + k) prefix lookups, where k is the number of actual matches.
// Before: O(n) scan per parent
for candidate_id in all_ids.iter() {
    if candidate_id.starts_with(&prefix) { ... }
}

// After: O(log n + k) range query
let end = prefix_successor(&prefix);
for candidate_id in self.all_ids_sorted.range(prefix.clone()..end) { ... }
The prefix_successor() helper computes the exclusive upper bound for a prefix range query by incrementing the last byte. "worker-1." becomes "worker-1/" — the BTreeSet’s range() returns exactly the IDs that start with the prefix.
Impact: Hierarchy building at 50K entries dropped from 85,932ms to 349ms. That’s 246x faster.
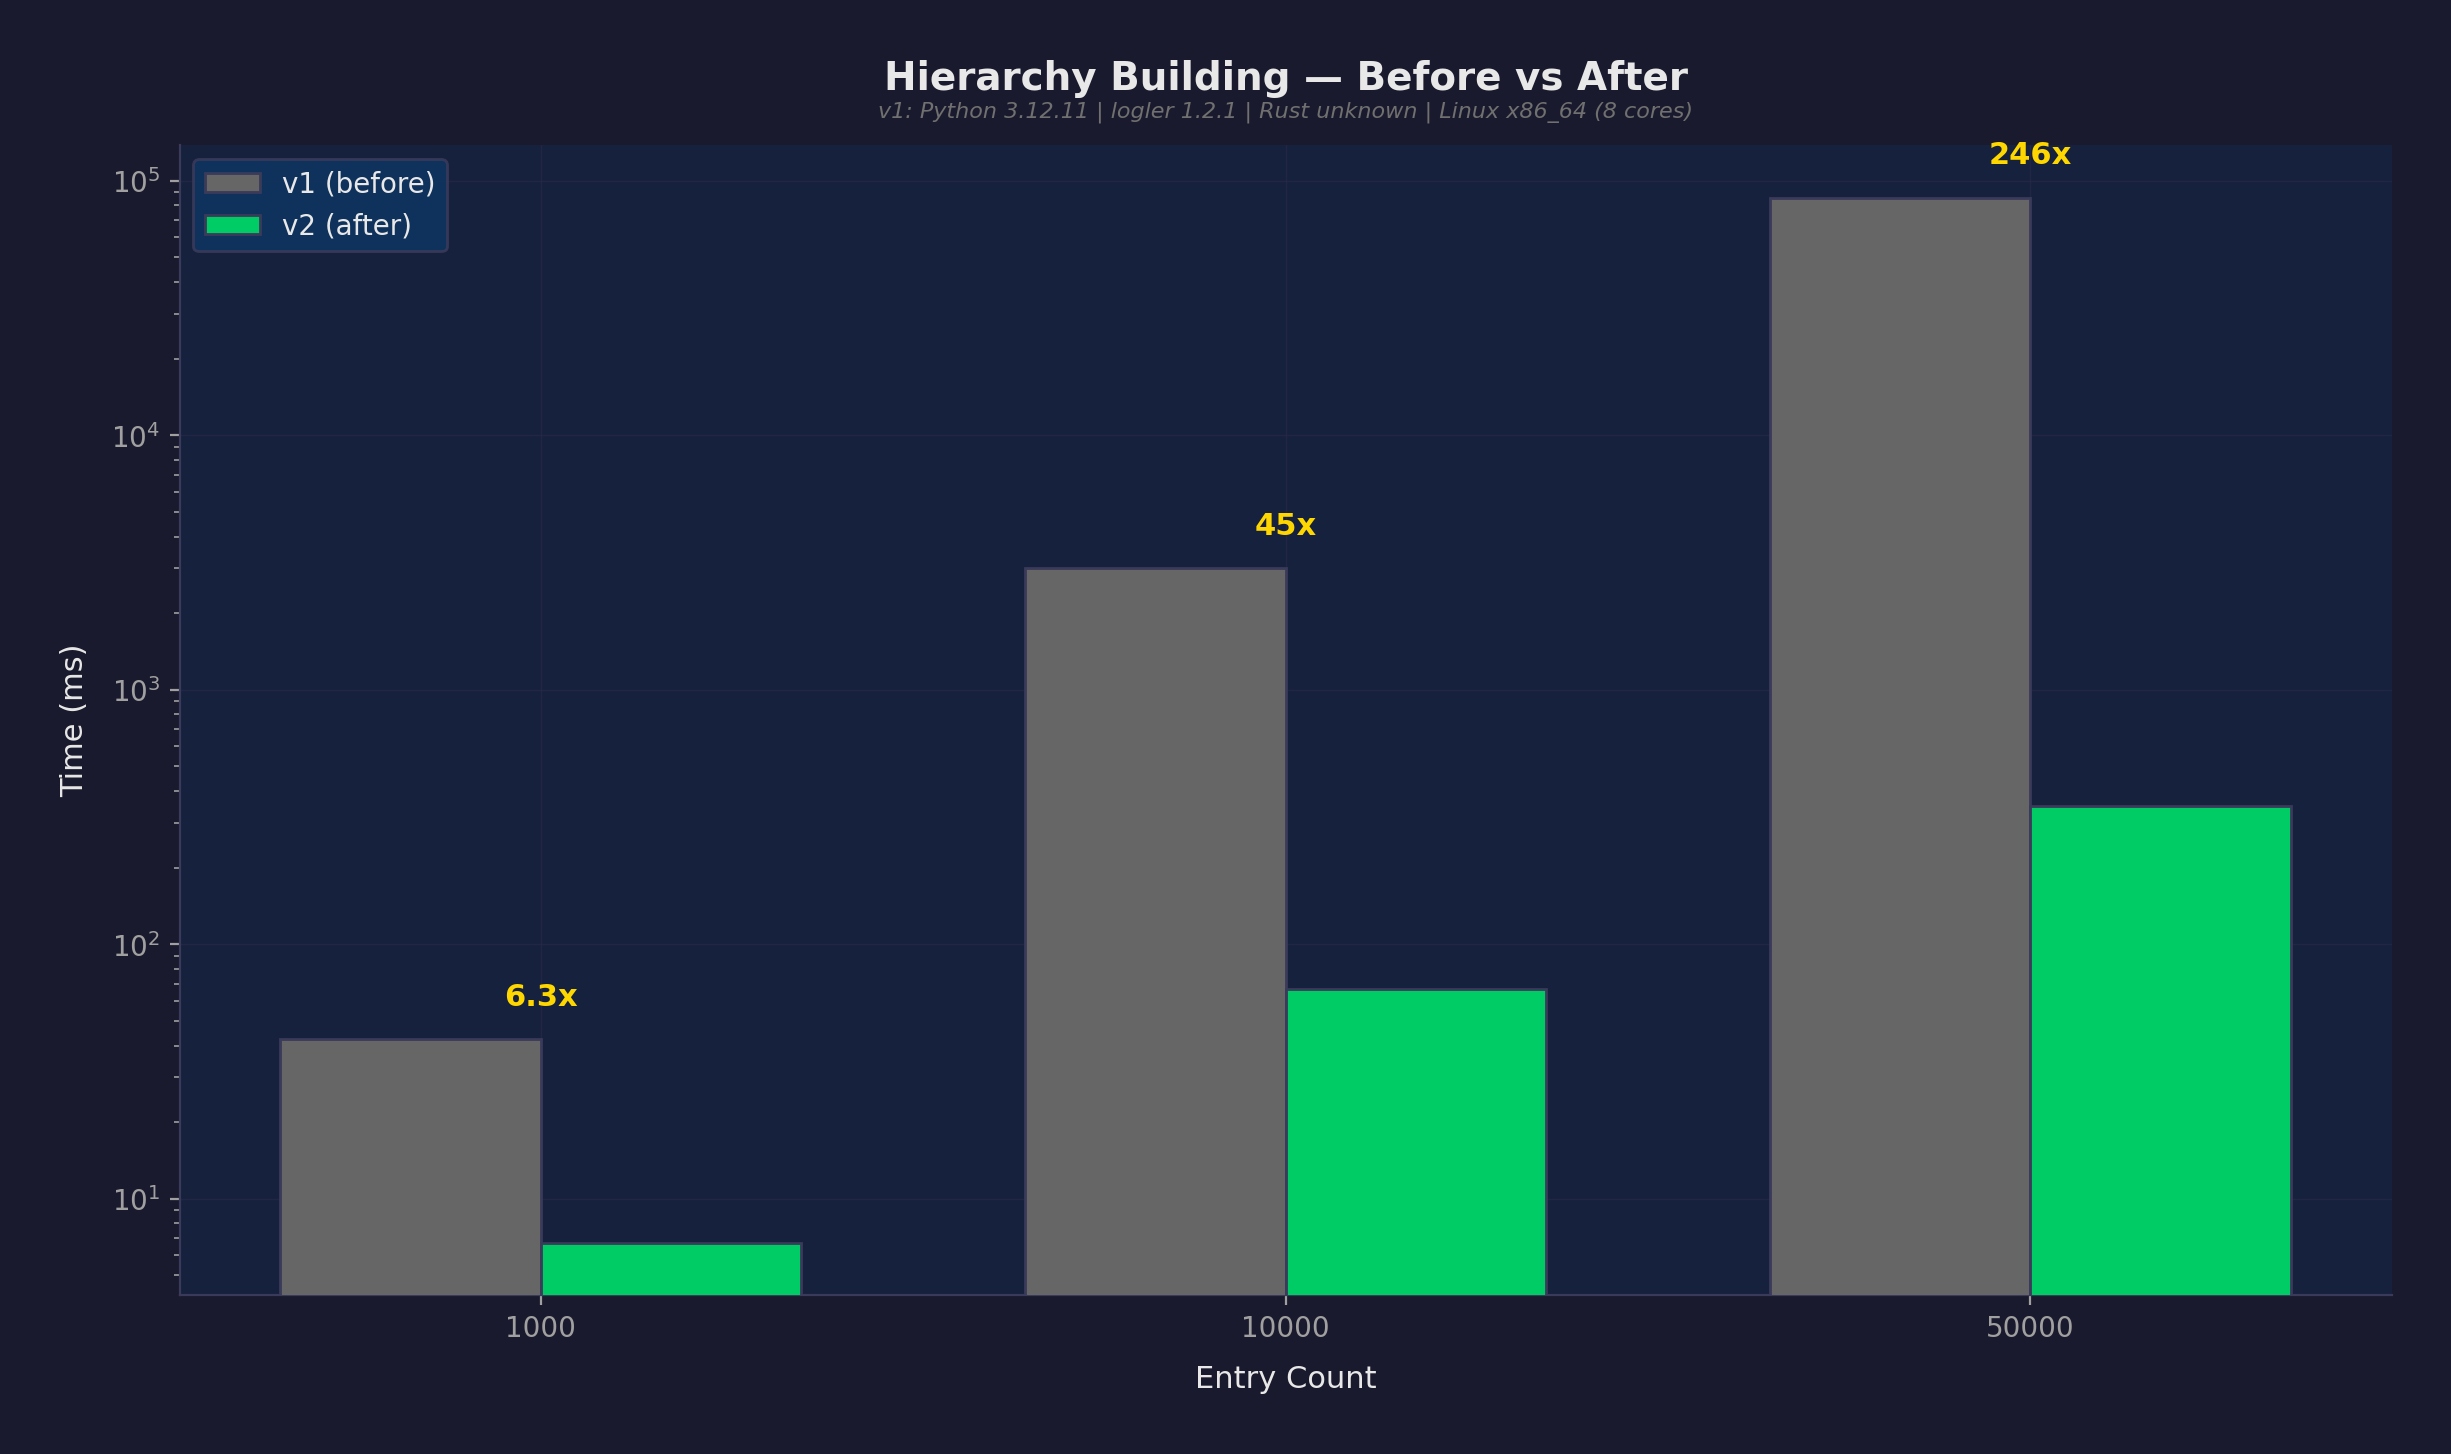
This is a definitive improvement — v2’s worst case (360ms) is faster than v1’s best case (85,700ms). Zero overlap in timing distributions.
Change 3: Capped Smart Sample Fetch
Problem: smart_sample() called search(files, level=level, limit=None) — fetching ALL entries into Python as JSON dictionaries, then sampling 50. At 50K entries, Python was deserializing 50,000 JSON objects into dicts, then throwing away 49,950 of them.
Fix: Cap the fetch to max(sample_size * 10, 500) entries. For the errors_focused strategy, use two targeted fetches (errors + context) instead of one huge fetch. The Rust search result already includes total_matches — the true pre-truncation count — so we get the exact population size without a separate count query.
What didn’t work: The first attempt added a separate search(output_format="count") call to get the population count “cheaply.” This caused a regression because output_format="count" still does a full Rust search internally — it’s not a lightweight count query. For errors_focused, three searches instead of one. The fix was removing the count query entirely and reading total_matches from the capped search result.
Impact: Sampling at 10K entries dropped from 778ms to 196ms (4x faster). At 50K entries, from 9,075ms to 6,333ms (1.4x faster).
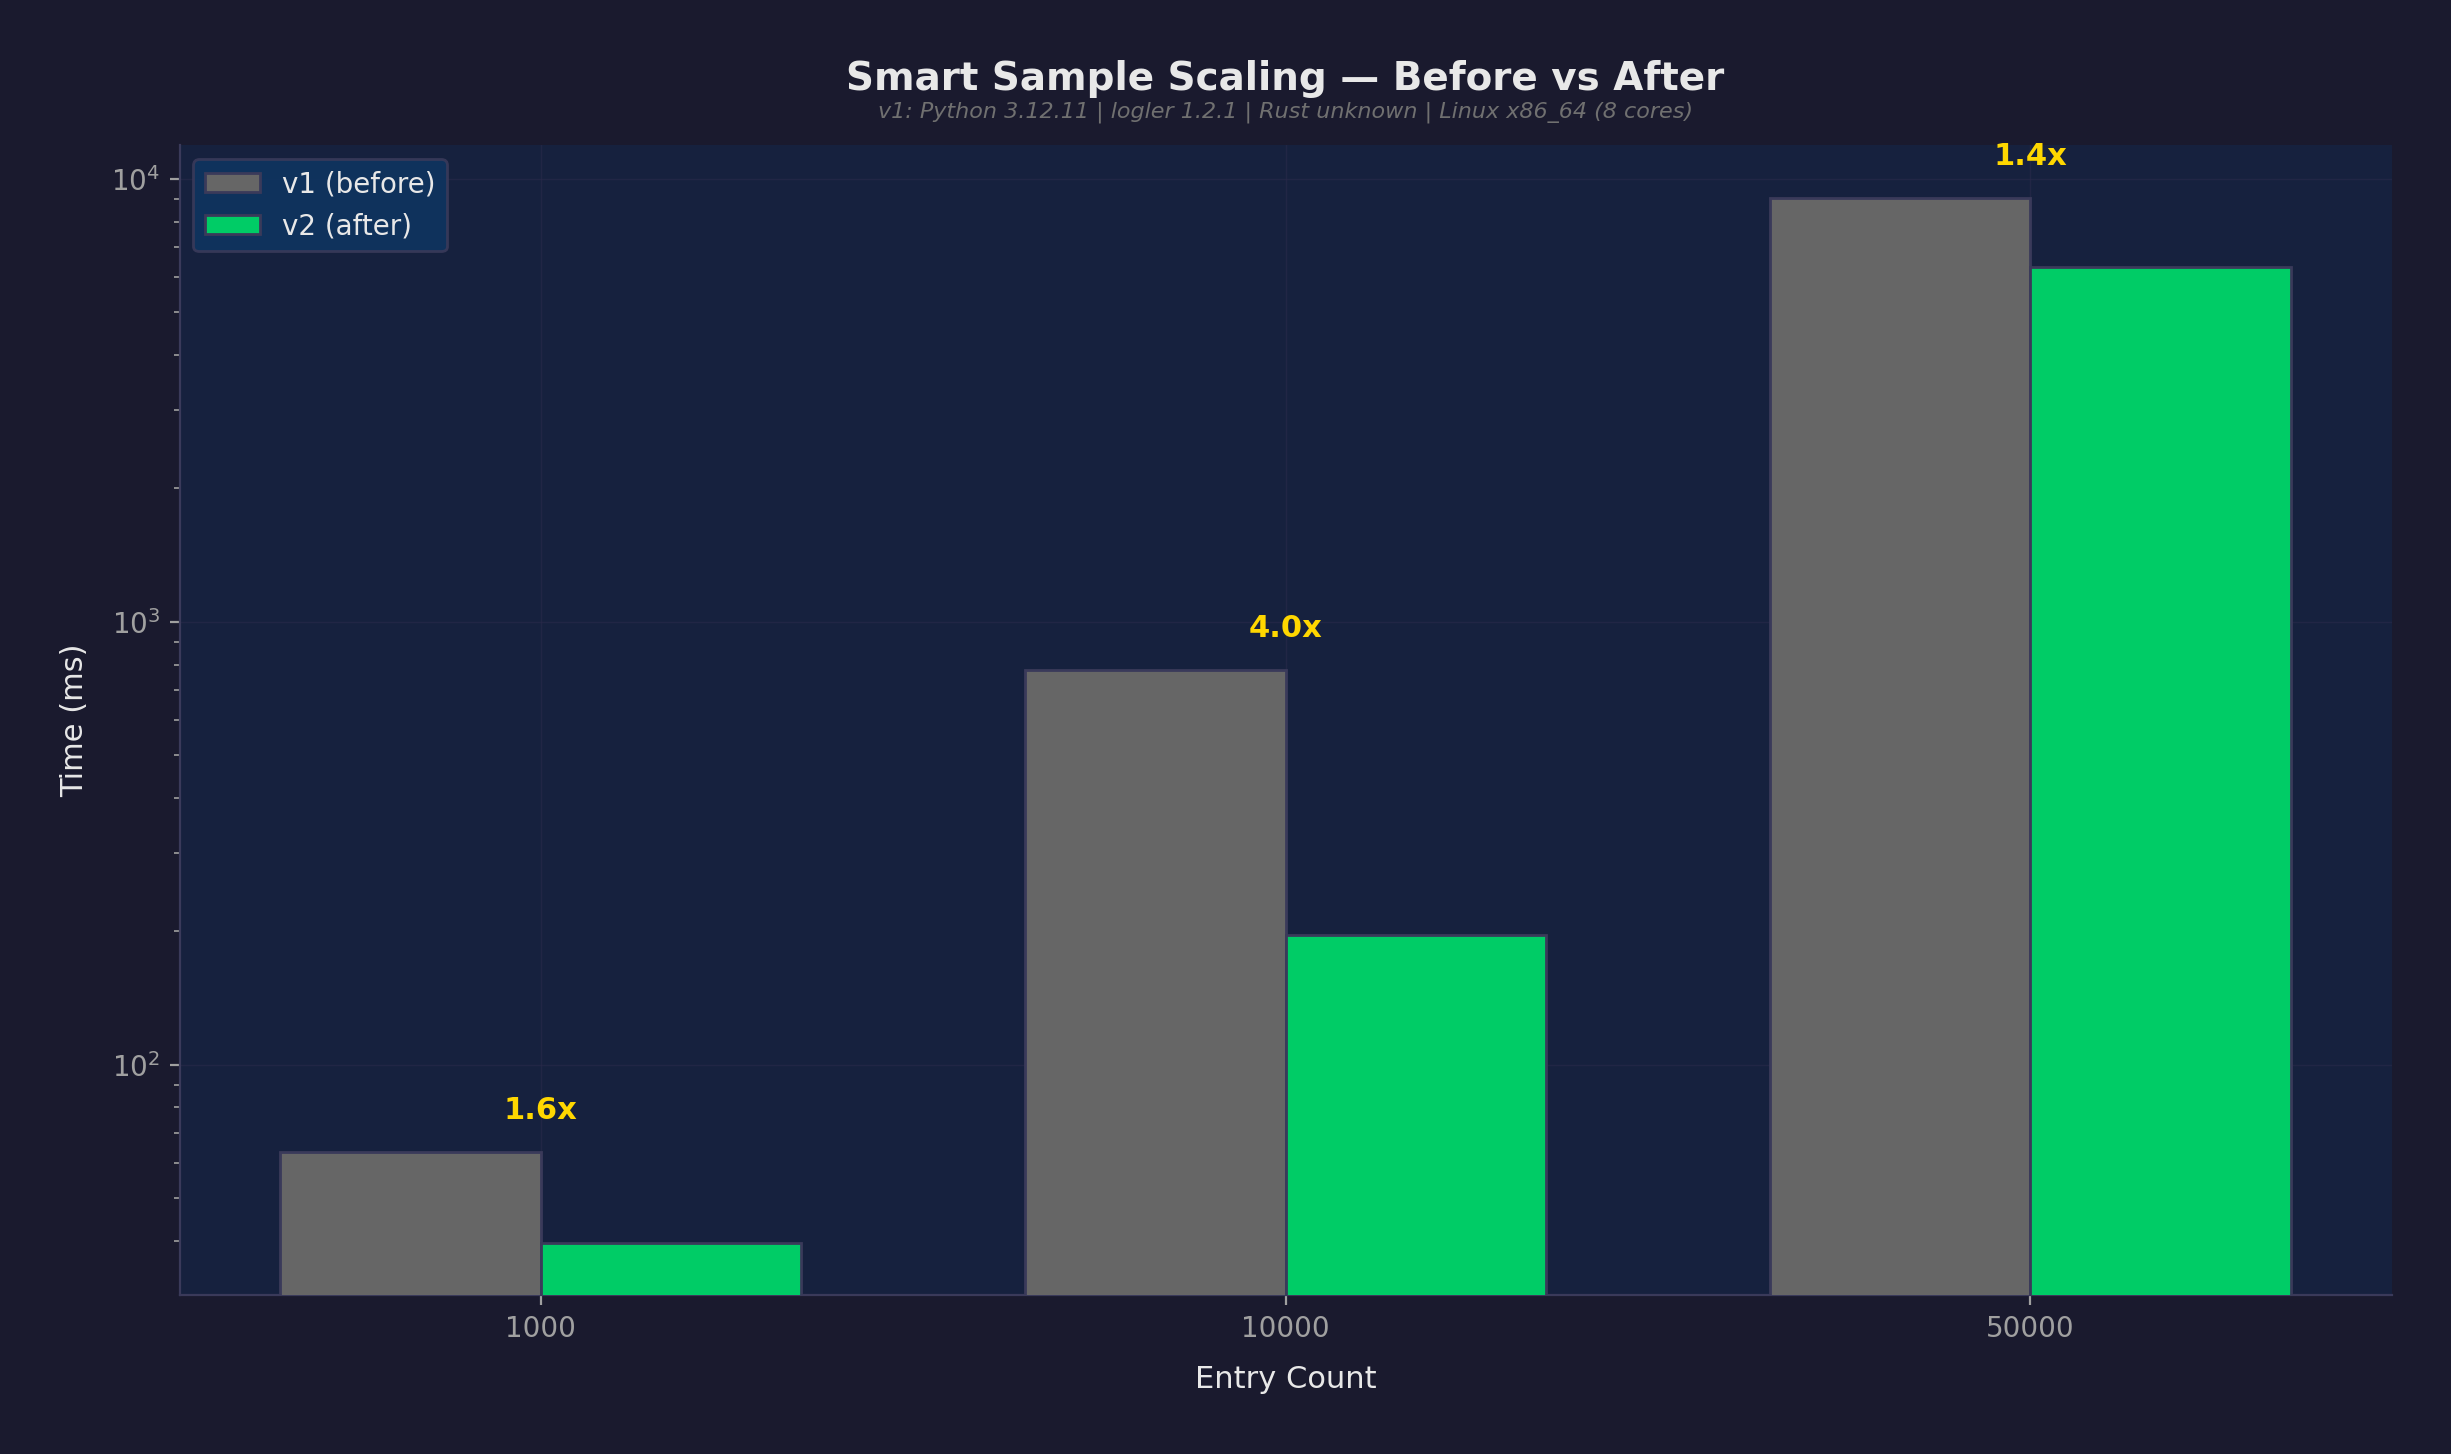
The modest improvement at 50K reflects reality: the Rust search cost dominates. It still collects all matching results internally before truncating to limit. The savings come from not deserializing 50K JSON objects in Python. At 10K, the savings are proportionally larger because deserialization overhead was a bigger fraction of total time.
Full Results
All 43 measurements, ranked by speedup:
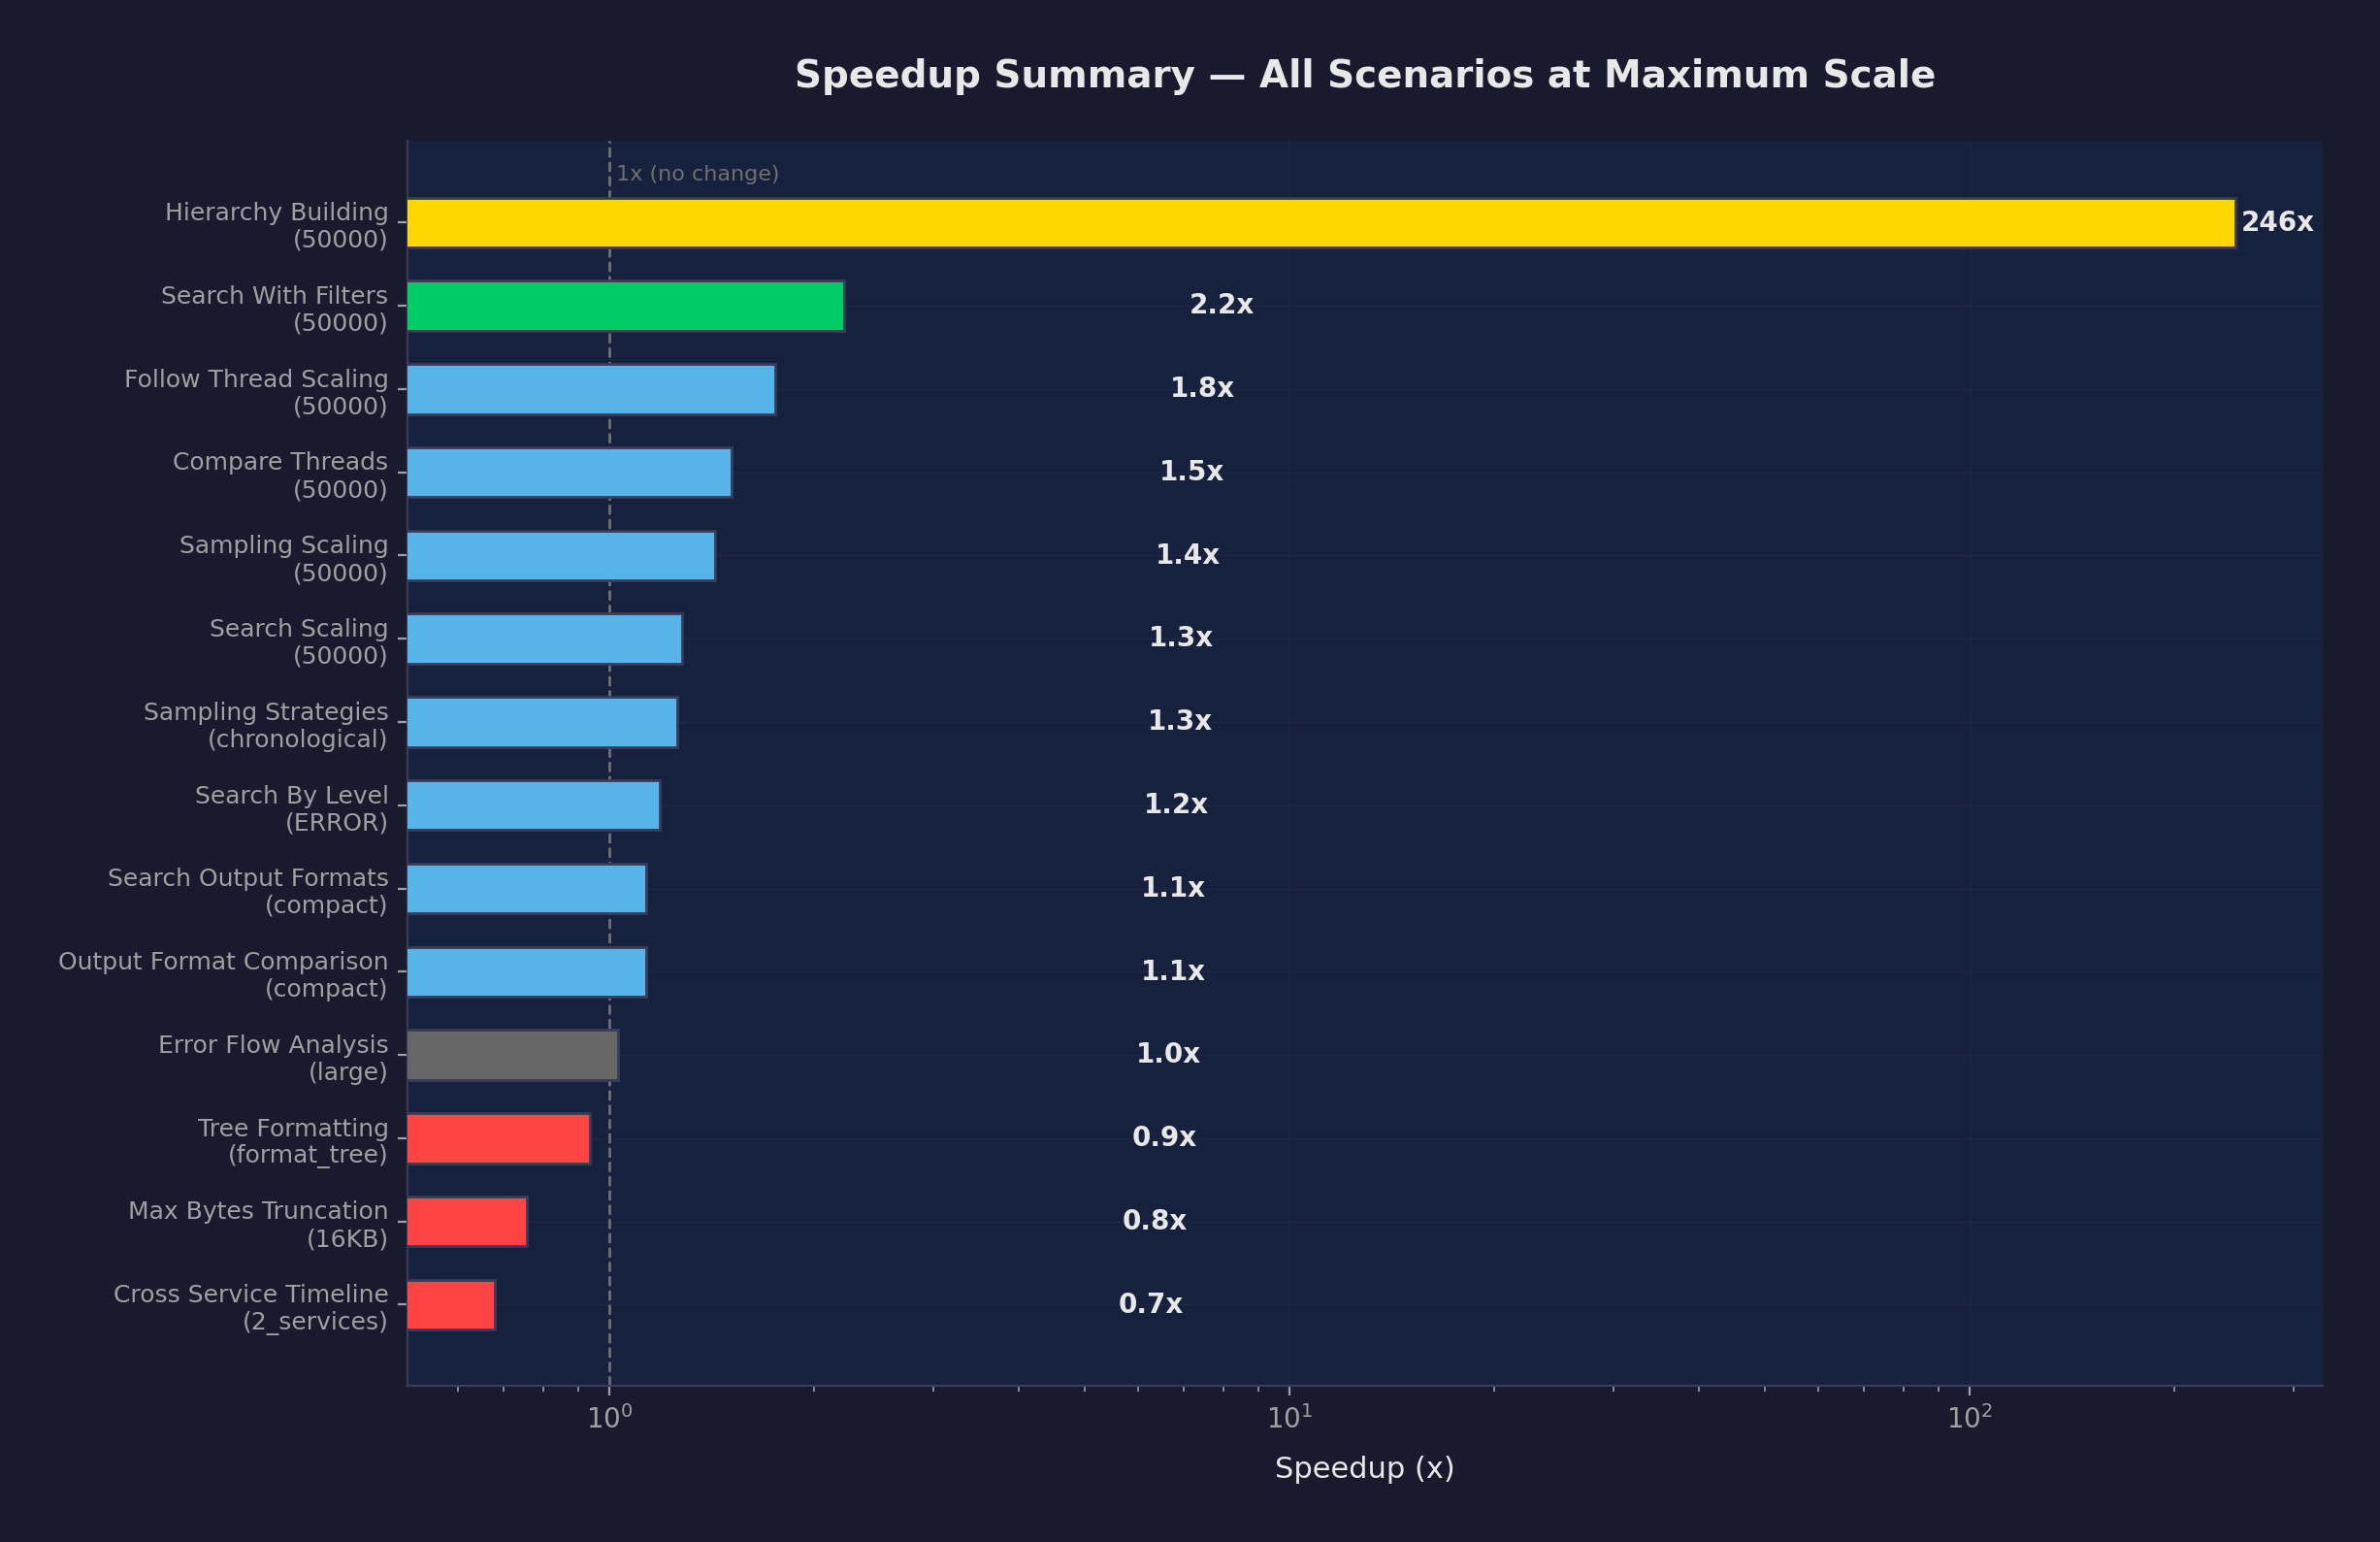
Top Improvements (2x+ speedup)
| Scenario | Scale | v1 | v2 | Speedup | Confidence |
|---|---|---|---|---|---|
| hierarchy_building | 50K | 85.9s | 349ms | 246x | definitive |
| hierarchy_building | 10K | 3.01s | 67ms | 45x | definitive |
| follow_thread | 1K | 2.6ms | 0.38ms | 6.8x | definitive |
| hierarchy_building | 1K | 42ms | 6.7ms | 6.3x | definitive |
| search_with_filters | 10K | 25ms | 4.5ms | 5.6x | definitive |
| sampling_scaling | 10K | 778ms | 196ms | 4.0x | definitive |
| compare_threads | 1K | 6.2ms | 1.6ms | 3.9x | definitive |
| compare_threads | 10K | 64ms | 18ms | 3.5x | definitive |
| search_with_filters | 1K | 3.6ms | 1.0ms | 3.5x | definitive |
| follow_thread | 10K | 28ms | 12ms | 2.3x | definitive |
| search_with_filters | 50K | 173ms | 78ms | 2.2x | definitive |
Moderate Improvements (1.1-2x speedup)
| Scenario | Scale | v1 | v2 | Speedup |
|---|---|---|---|---|
| search_scaling | 10K | 39ms | 20ms | 2.0x |
| follow_thread | 50K | 259ms | 148ms | 1.75x |
| sampling_scaling | 1K | 64ms | 40ms | 1.6x |
| compare_threads | 50K | 534ms | 353ms | 1.5x |
| sampling_scaling | 50K | 9.07s | 6.33s | 1.43x |
| search_scaling | 1K | 6.9ms | 5.1ms | 1.3x |
| search_scaling | 50K | 694ms | 543ms | 1.28x |
| sampling (chronological) | 50K | 9.13s | 7.24s | 1.26x |
Within Noise / Unchanged
| Scenario | Scale | v1 | v2 | Change |
|---|---|---|---|---|
| error_flow (large) | — | 1.73ms | 1.68ms | ~same |
| tree_formatting (summary) | — | 0.011ms | 0.011ms | ~same |
| search_by_level (INFO) | 50K | 3.71s | 3.77s | ~same |
Regressions (Honest)
| Scenario | Scale | v1 | v2 | Slowdown | Note |
|---|---|---|---|---|---|
| max_bytes_truncation | 16KB | 1.14s | 1.51s | 1.32x | Not in optimized path |
| max_bytes_truncation | 4KB | 1.12s | 1.33s | 1.18x | Not in optimized path |
| cross_service_timeline | 2 svcs | 5.2ms | 7.6ms | 1.47x | Likely system noise |
| max_bytes_truncation | 1KB | 1.11s | 1.25s | 1.13x | Not in optimized path |
The max_bytes_truncation regressions are consistent across all three parameters, suggesting a real (if small) slowdown. However, none of the three optimizations touch that code path. This is likely variance from background system load during the benchmark run.
Methodology
Test Conditions
| Condition | v1 | v2 |
|---|---|---|
| Scale | small | small |
| Python | 3.12.11 | 3.12.11 |
| Rust backend | yes | yes |
| Platform | Linux x86_64 (8 cores) | same |
| logler version | 1.2.1 | 1.2.1 |
| Data generation | LogGenerator(seed=42) | same |
Confidence Classification
| Level | Criteria |
|---|---|
| Definitive | v2 worst case (max) < v1 best case (min). Zero overlap. |
| High | v2 p95 < v1 median. 95% of v2 runs beat typical v1. |
| Moderate | >10% median change, some overlap. |
| Marginal | 3-10% change. Could be noise. |
| Within noise | <3% change. Not a real difference. |
All measurements marked “definitive” have zero overlap in timing distributions. This is a conservative bar — even “high confidence” means 95% of v2 runs outperform the typical v1 run.
Statistical Integrity
- No cherry-picking. Every scenario from v1 is re-run in v2. All results reported.
- Same data generation seed. Identical synthetic logs across both runs.
- Same machine. Both runs on identical hardware.
- Warm caches. Warmup iterations discarded before measurement.
- Coefficient of variation reported. High CV (>20%) means noisy measurement.
- Regressions reported honestly. 4 regressions listed with notes.
What’s Left
The three optimizations addressed the worst bottlenecks. What remains:
- Rust search is the floor — The engine collects all matching results before applying
limit. A true early-termination search would help sampling and large-result queries. format_tree()is slow — 1.7 seconds to render a hierarchy. The tree traversal + formatting needs optimization.- Python JSON deserialization — Every result crosses the Rust→Python boundary as a JSON string that gets
json.loads()’d. A direct PyO3 dict return would skip this. - Persistent indexing — Currently files are re-parsed on first access. A disk-based index would make cold starts instant.
These are real next targets, not hypothetical wish-list items.
Reproducing
# Run both benchmark sets
uv run python -m benchmarks run --scale small --tag v1
uv run python -m benchmarks run --scale small --tag v2

# Generate comparison
uv run python -m benchmarks compare \
  -b benchmarks/results/v1/baseline.json \
  -c benchmarks/results/latest.json \
  -o benchmarks/results/v2 \
  --changes benchmarks/results/v2/CHANGES.md
Every chart and number in this post is reproducible from the benchmark suite.