Logler Featured 
Rust-powered structured log investigation for local files, optimized for AI agents. Cross-service timeline reconstruction in 13ms, hierarchy building in 349ms at 50K entries, 25 JSON CLI commands.
Logler
Rust-powered structured log investigation from local files. Point at log files, get structured answers about what happened. Optimized for AI agent consumption — every command returns JSON, every output fits a token budget.
Why Logler?
There’s a gap between grep and Datadog. grep finds strings but can’t tell you what happened across services. ELK/Loki/Datadog require infrastructure, ingestion pipelines, and ongoing costs. Most debugging sessions start with local log files and a question: what went wrong?
Logler fills that gap. Parse local files, build an in-memory index, and answer structured questions — all without leaving your terminal.
Good fit: incident debugging, log triage for AI agents, cross-service correlation without infrastructure, any situation where you have log files and need answers fast.
Quick Start
from logler.investigate import search, follow_thread, extract_ids

# Search with structured filters
result = search(["app.log"], query="timeout", level="ERROR,WARN", limit=50)
print(f"Found {result['total_matches']} matches")

# Follow a thread across files
thread = follow_thread(["app.log", "worker.log"], thread_id="req-42")
for entry in thread["entries"]:
    print(f"{entry['timestamp']} [{entry['level']}] {entry['message']}")

# Extract all IDs for exploration
ids = extract_ids(["app.log"])
print(f"{len(ids['thread_ids'])} threads, {len(ids['services'])} services")
Rust parses and indexes the files. Python provides the investigation API. Every function returns a typed dict documented in types.py.
Architecture
Three-tier design — each layer does what it’s best at:
Rust core (4.3K LOC)    — Parsing, indexing, search, hierarchy building
PyO3 bridge             — Zero-copy FFI between Rust and Python
Python layer (14.2K LOC) — Correlation, sampling, metrics, CLI
The Rust core handles format detection (JSON, syslog, logfmt, plaintext), field extraction, and search. Python implements the algorithms that need flexibility: correlation engines, sampling strategies, metric extraction, format detection, template mining.
This is not a thin wrapper. The Rust core does real parsing and indexing. The Python layer has real algorithms. DuckDB/SQL is a 220-line optional escape hatch for ad-hoc queries.
Performance
Real numbers from the benchmark suite (14 scenarios, Python 3.12, Rust backend):
| Operation | Result | Context |
|---|---|---|
| Hierarchy building | 349ms | 50K entries (was 86s before optimization) |
| Cross-service timeline | 13ms | 5 services correlated |
| Error flow analysis | <2ms | Full error propagation tree |
| Follow thread | 148ms | 50K entries |
| Token savings | 2,540x | count vs full output format |
| Smart sampling | 196ms | 10K entries, 50 representative samples |
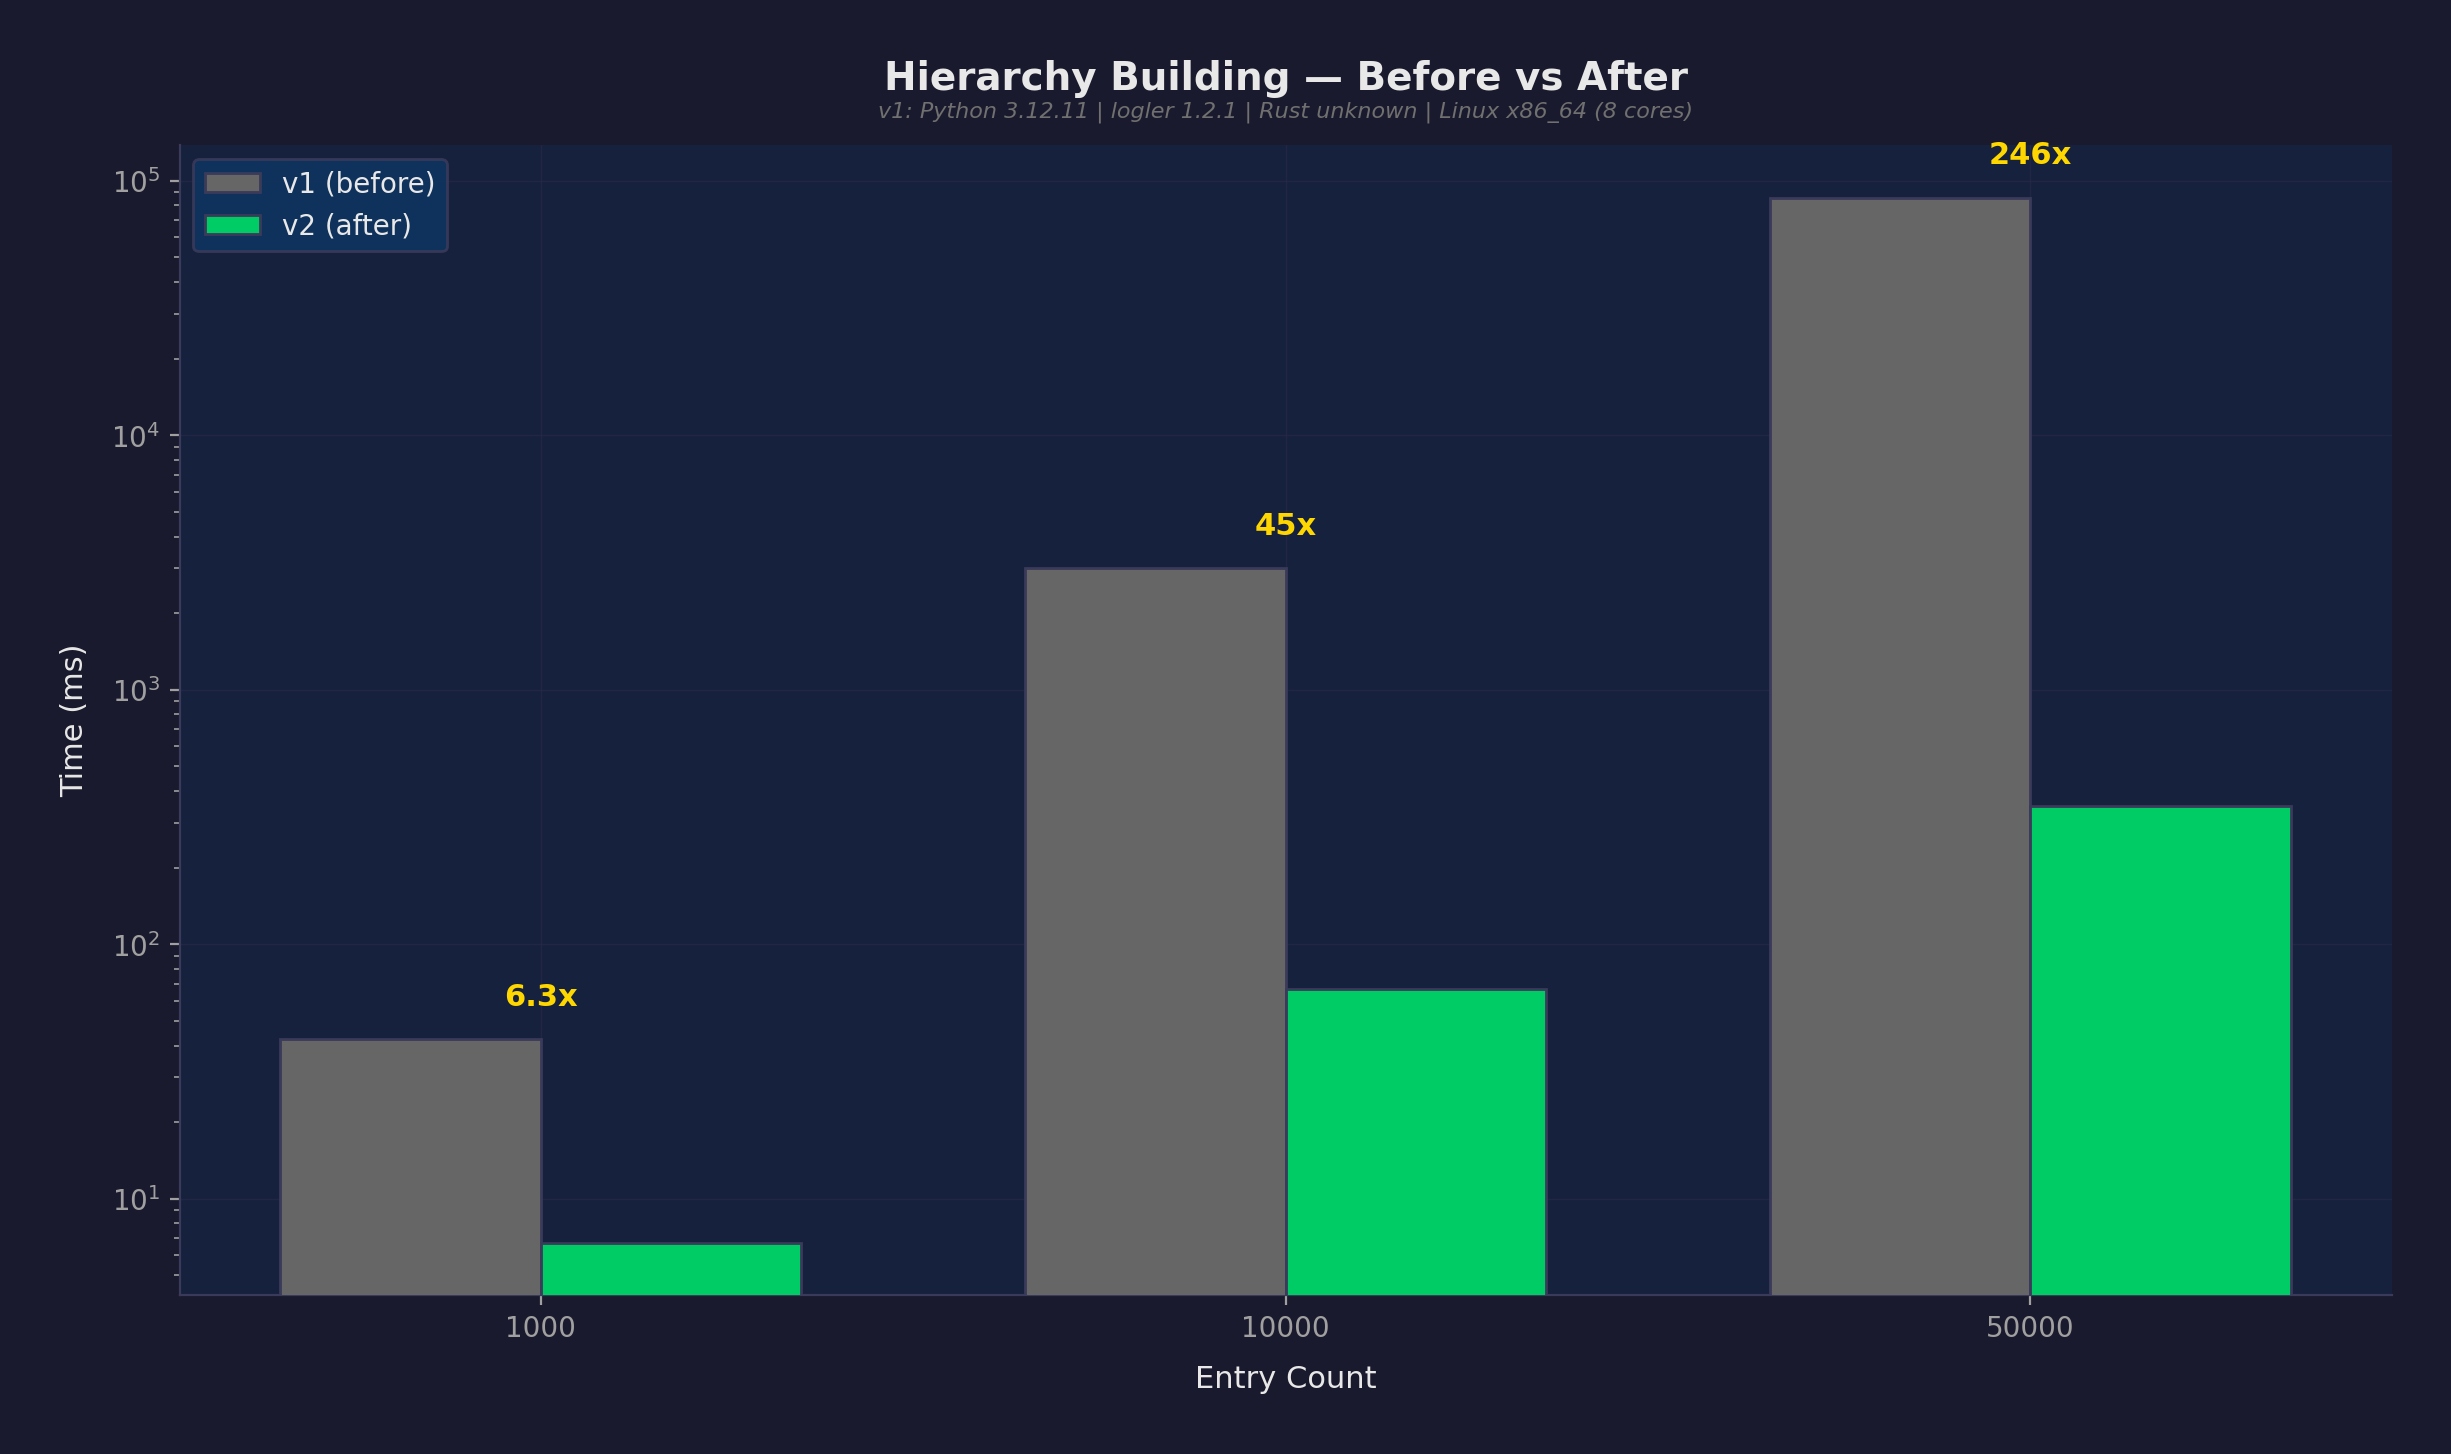
The single most impactful optimization: BTreeSet prefix index for hierarchy naming inference. Replaced an O(n^2) linear scan with O(log n + k) range queries. At 50K entries, this took hierarchy building from 86 seconds to 349 milliseconds.
Features
25 JSON CLI Commands
Every command returns structured JSON. No parsing stdout, no regex on human-readable output. Purpose-built for LLM agents:
# Triage — what's wrong?
logler llm triage app.log worker.log

# Search with token budget
logler llm search app.log --level ERROR --max-bytes 4096

# Cross-service correlation
logler llm correlate app.log worker.log --thread-id req-42

# Hierarchy — parent/child thread relationships
logler llm hierarchy app.log --root worker-1
Assessment: triage, summarize, schema
Discovery: ids
Search: search, sql
Tracing: correlate, hierarchy, bottleneck
Comparison: compare, diff
Utilities: sample, context, export, emit, session, verify-pattern
Metrics & Detection: metrics, detect, templates
Formats: format list, format test, format validate
Correlations: correlation list, correlation run, correlate-events
Cross-Service Timeline
Reconstruct what happened across services by correlating thread IDs, correlation IDs, and trace IDs:
from logler.investigate import cross_service_timeline

timeline = cross_service_timeline(
    ["api.log", "worker.log", "db.log"],
    correlation_id="req-42"
)
# Returns entries from all services, ordered by timestamp
Smart Sampling
Intelligent sampling strategies for large log files — get representative samples without reading everything:
from logler.investigate import smart_sample

sample = smart_sample(
    ["app.log"],
    strategy="errors_focused",  # or: representative, diverse, chronological
    sample_size=50
)
# 50 entries that represent the full dataset
Thread Hierarchy
Build parent-child relationships from naming patterns (worker-1 -> worker-1.task-a), span IDs, and correlation chains:
from logler.investigate import follow_thread_hierarchy

hierarchy = follow_thread_hierarchy(
    ["app.log"],
    root_identifier="worker-1"
)
# Tree structure with timing, error propagation, bottleneck analysis
Token Budget Control
Every search command supports --max-bytes to fit output within an LLM’s token budget:
# Fit results in 4KB for GPT-4 context
logler llm search app.log --level ERROR --max-bytes 4096

# Count-only format: 202 bytes vs 513,019 bytes (2,540x savings)
logler llm search app.log --count-only
Format Auto-Detection
Automatic detection of JSON, syslog (RFC 3164/5424, BSD), logfmt, Apache CLF, and plaintext. Custom formats via .logler.toml:
[formats.my-app]
pattern = '(?P<timestamp>\d{4}-\d{2}-\d{2}T[\d:.]+Z)\s+(?P<level>\w+)\s+\[(?P<thread_id>[\w-]+)\]\s+(?P<message>.*)'
timestamp_format = "%Y-%m-%dT%H:%M:%S%.fZ"
More
| Feature | Description |
|---|---|
| Metrics extraction | Numeric value extraction, stats, z-score anomaly detection |
| Template mining | Drain algorithm for log template discovery |
| Error flow analysis | Trace error propagation through service hierarchies |
| Bottleneck detection | Identify slowest spans in a trace |
| SQL escape hatch | DuckDB-powered ad-hoc queries when you need them |
| Event correlation | Cross-file event correlation with time windows |
| Session management | Stateful investigation sessions with notes |
| Export | Jaeger/Zipkin trace format export |
Interactive Tours
17 Jupyter notebook tours demonstrating every capability:
| Tour | Topics |
|---|---|
| 01. Quick Start | Search, filter, basic investigation |
| 02. Thread Tracking | Follow threads across files |
| 03. Hierarchy | Parent-child relationships, tree formatting |
| 04. Cross-Service | Multi-file correlation, timeline reconstruction |
| 05. Error Analysis | Error flow, propagation trees |
| 06. Smart Sampling | Sampling strategies, coverage analysis |
| 07. Output Formats | Full, summary, compact, count |
| 08. SQL | DuckDB ad-hoc queries |
| 09. Metrics | Numeric extraction, anomaly detection |
| 10. Format Detection | Auto-detect, custom formats |
| 11. Template Mining | Drain algorithm, pattern discovery |
| 12. Sessions | Stateful investigations |
| 13. Event Correlation | Time-windowed cross-file events |
| 14. Bottleneck | Span timing analysis |
| 15. Filtering | Advanced filter combinations |
| 16. Export | Jaeger/Zipkin trace export |
| 17. CLI | Full LLM CLI walkthrough |
Honest Limitations
- No persistent index — Files are re-parsed on first access per session. The LRU cache avoids re-parsing on repeated queries, but there’s no disk-based index.
- Single machine — Designed for local files, not distributed log collection. This is the point, not a limitation — but if you need multi-machine ingestion, use Loki.
- Rust search is the floor — The Rust engine collects all matching results before truncating to
limit. Alimit=10query still scans all entries internally. - Smart sampling bottleneck — At 50K entries, sampling still takes 6+ seconds because the Rust search cost dominates (not the sampling algorithm).
Getting Started
pip install logler # or: uv add logler
Python 3.12+ with Rust backend (pre-compiled wheels for Linux/macOS).
uv run pytest -q                  # 1,064 tests
uv run python -m benchmarks run   # 14 benchmark scenarios
日本語版: このプロジェクトを日本語で読む